The average weekly rent rose by 16.8% between 2011 and 2016.
The average weekly rent paid to private landlords when the Census was taken last April was
€199.92, according to figures released by the Central Statistics Office (CSO) on Thursday, a 16% increase on the 2011 figure of
€171.19.
The figures in the first thematic report of the Census 2016 results - Profile 1 Housing in Ireland – showed that the most significant increases in rent prices were found in Dublin City (an increase of 30% since 2011), with prices in Dún Laoghaire-Rathdown (26.2%), Fingal (22.8%), South Dublin (22.7%) and Kildare (20.3%) also seeing sharp increases in that period.
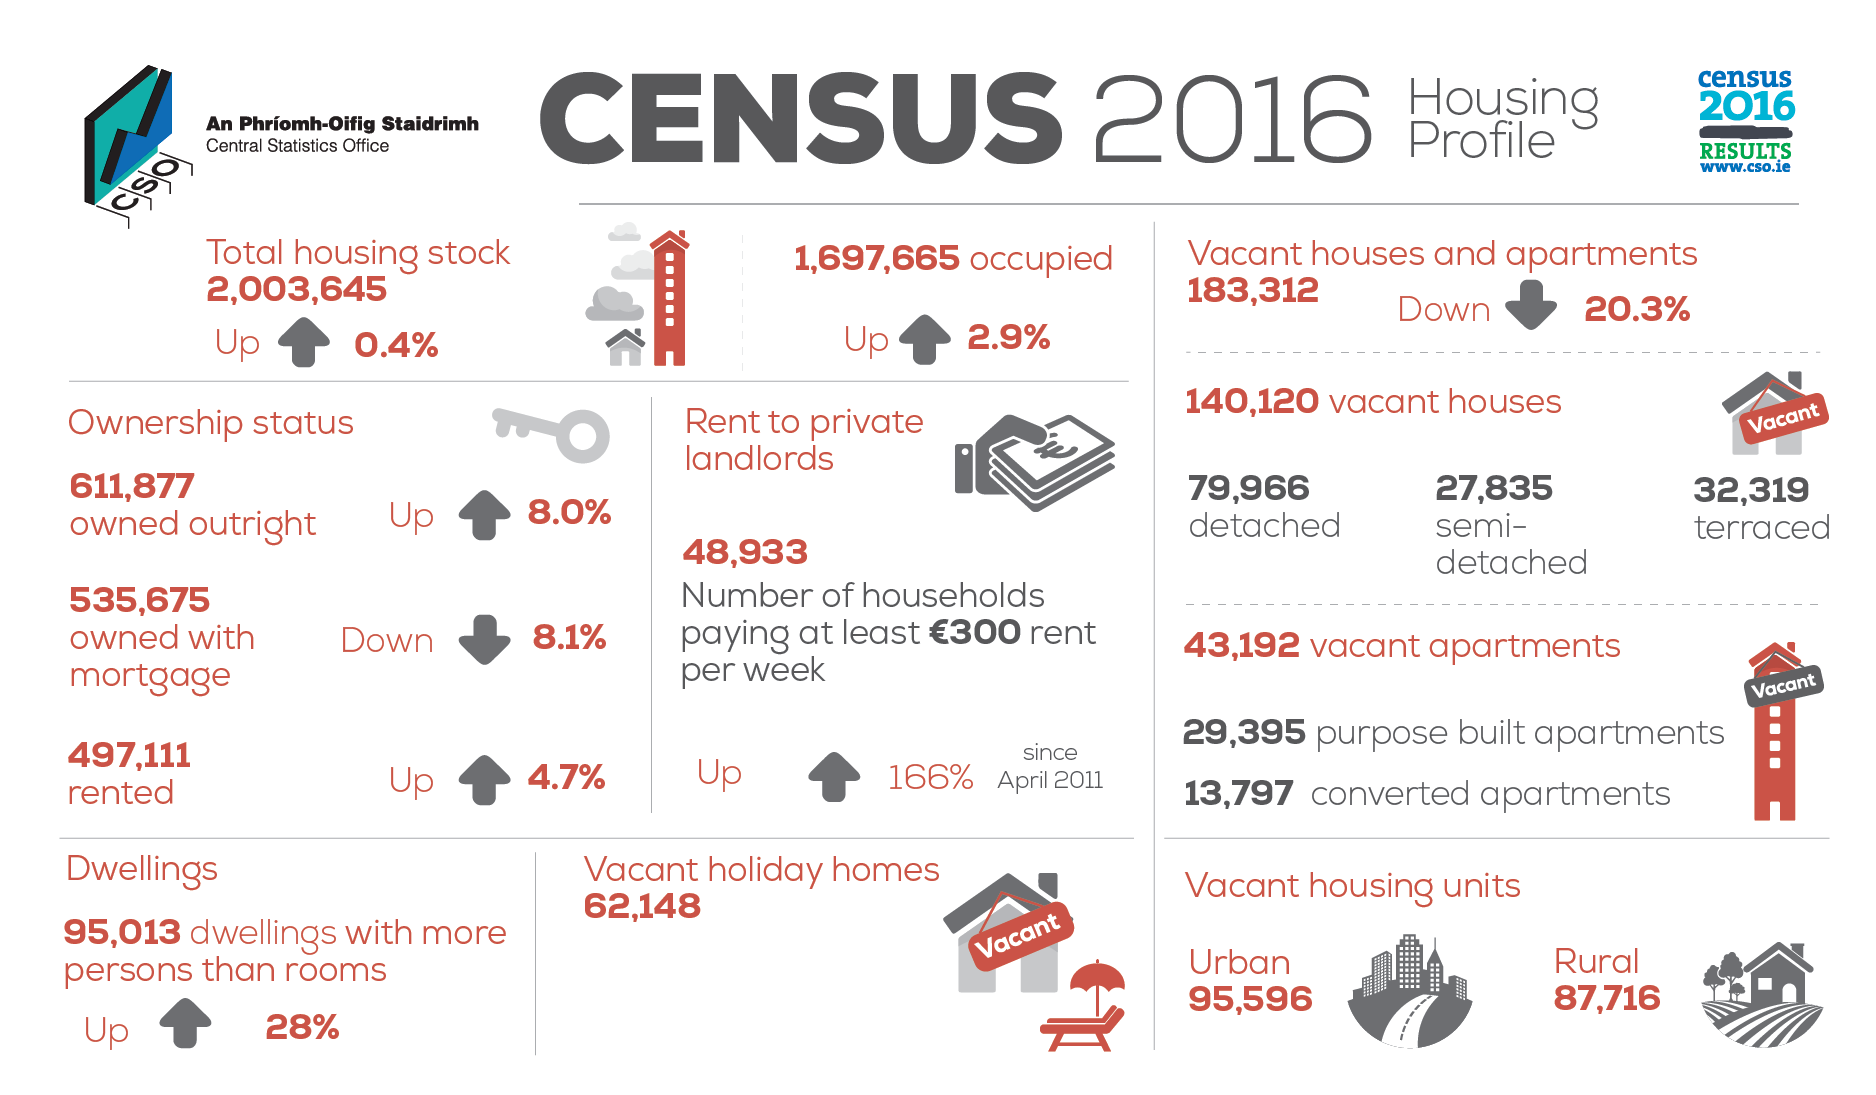 Pic via cso.ie
The report also revealed that there were a little under 50,000 households (48,933) paying a weekly figure of at least €300 in rent to private landlords in April of last year, an increase of a whopping 166% in just five years.
The report can be viewed in more detail
here, while the average weekly rent in Ireland’s major cities and in towns with certain population brackets can be viewed below.
Average weekly rent in Ireland (as of April 2016)
State: €199.92
Dublin city and suburbs: €282.17
Cork city and suburbs: €211.04
Limerick city and suburbs: €160.45
Galway city and suburbs: €205.57
Waterford city and suburbs: €135.37
Towns 10,000 population and over: €168.92
Towns 5,000 – 9,999 population: €155.36
Towns 2,000 – 4,999 population: €139
Towns 1,500 – 1,999 population: €125.15
Towns 1,000 – 1,499 population: €123.27
Towns 500 – 999 population: €127
Towns under 500 population with at least 50 inhabited houses: €120.41
Remainder of country: €135.64


